/prod01/twu-cdn-pxl/media/images/student-success/Success-Hero.jpg)
Texas Woman’s: A Place to Succeed
/prod01/twu-cdn-pxl/media/images/student-success/Cape-Minerva-670px.jpg)
Our Commitment
Texas Woman’s is committed to the success of all students. Here learning extends beyond the classroom to prepare students not just for jobs, but for careers, leadership, service, health and happiness. Our faculty and staff support each student to achieve their goals enabling them to contribute to the State of Texas and beyond.
Academic Success for All
Graduation Rates
TWU monitors and evaluates graduation rates of undergraduate students utilizing the Integrated Postsecondary Education Data Systems (IPEDS) Graduation Rate (150% standard time) as a student completion indicator.
To understand our performance relative to peer institutions, TWU establishes an annual baseline as well as an annual target for graduation rates. As illustrated in the table below, TWU’s performance against the baseline and target indicate a positive trend demonstrating TWU’s commitment to student achievement and success.
Goal: By 2028, TWU’s graduation rate for first-time-in-college students will be 50%.
swipe to see the full table⇨
| Performance | 2009 | 2010 | 2011 | 2012 | 2013 | 2014 | 2015 | 2016 | 2017 |
|---|---|---|---|---|---|---|---|---|---|
| TWU | 40% | 38% | 35% | 42% | 43% | 47% | 48% | 47% | 44% |
| Baseline | 38% | 38% | 41% | 41% | 43% | 44% | 44% | 44% | 44% |
| Target | 46% | 46% | 46% | 47% | 49% | 50% | 50% | 50% | 50% |
Source: TWU Retention and Graduation Fact Book and Peer Institutions
Graduation Rate Disaggregation by Variable
Socioeconomic Status
TWU’s undergraduate student population consists of a high number of students receiving need-based federal and state financial aid. Through analysis, TWU utilizes Pell grant eligibility as an indicator of socioeconomic status. The table below illustrates the six-year graduation rate for first-time-in-college students, by entering cohort, comparing Pell grant eligible students to non-Pell grant eligible students.
Goal: By 2028, the graduation rate for Pell eligible students will increase by 10% from the 2009 entering class.
swipe to see the full table⇨
| Pell | Fall 2009 | Fall 2010 | Fall 2011 | Fall 2012 | Fall 2013 | Fall 2014 | Fall 2015 | Fall 2016 | Fall 2017 |
|---|---|---|---|---|---|---|---|---|---|
| Non-Pell Eligible | 45.7% | 46.9% | 47% | 52.8% | 50.9% | 53.2% | 54.4% | 53.2% | 47.1% |
| Pell Eligible | 33.2% | 31% | 27.6% | 34.7% | 35.6% | 42.1% | 42.4% | 41.9% | 41.1% |
Major Selection
Each year, approximately 40% of the first-time-in-college student populations enters TWU with the chosen major of nurse-entry. This major represents the largest major for the institution; therefore, TWU has selected this major as a critical variable to track.
Goal: By 2028, increase the percentage of graduates with an originally declared major of pre-nursing by 5%.
swipe to see the full table⇨
| Major | Fall 2009 | Fall 2010 | Fall 2011 | Fall 2012 | Fall 2013 | Fall 2014 | Fall 2015 | Fall 2016 | Fall 2017 |
|---|---|---|---|---|---|---|---|---|---|
| Nurse Entry | 34.9% | 27.6% | 28.7% | 37.5% | 39.8% | 46% | 42.3% | 42.9% | 39.7% |
| Non-Nurse Entry | 42.6% | 44.2% | 39.8% | 44.9% | 44.5% | 48.3% | 51.6% | 50.1% | 46.7% |
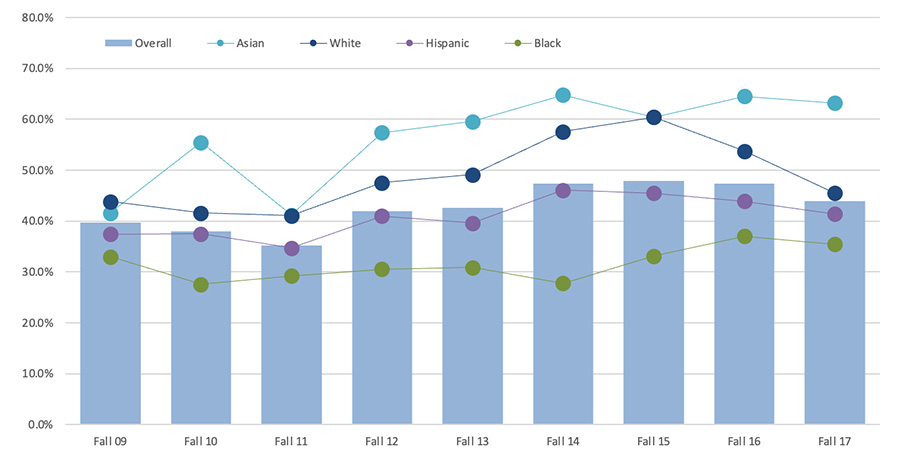
Ethnicity
Recognized as one of the most diverse universities in the country, Texas Woman’s University is committed to helping students succeed in their educational goals. TWU reviews and monitors graduation rates by racial and ethnic group to ensure all students are successful. The table below illustrates current graduation rates by race and ethnicity.
Goal: By 2028, narrow the performance gap between the overall average graduation rate and Black students, and; by 2028, narrow the performance gap between the overall average graduation rate and Hispanic students.
swipe to see the full table⇨
| Ethnicity | Fall 09 | Fall 10 | Fall 11 | Fall 12 | Fall 13 | Fall 14 | Fall 15 | Fall 16 | Fall 17 |
|---|---|---|---|---|---|---|---|---|---|
| Overall | 39.6% | 38.0% | 35.2% | 42.0% | 42.6% | 47.4% | 47.8% | 47.4% | 43.9% |
| Asian | 41.6% | 55.4% | 41.2% | 57.4% | 59.5% | 64.8% | 60.4% | 64.5% | 63.2% |
| White | 43.8% | 41.6% | 41.1% | 47.6% | 49.1% | 57.6% | 60.4% | 53.8% | 45.5% |
| Hispanic | 37.4% | 37.5% | 34.7% | 41.0% | 39.6% | 46.1% | 45.5% | 43.9% | 41.4% |
| Black | 33.0% | 27.6% | 29.2% | 30.5% | 30.9% | 27.8% | 33.1% | 37% | 35.4% |
Transfer Student Inclusion
Our undergraduate student population is made up of approximately equal portions first time in college (FTIC) students and students who transfer from another institution to complete their degree at TWU.
The university is pioneering a more holistic approach to reporting its graduation rate by including all of its undergraduate degree-seeking students in the calculation. This method includes counting transfer students, who comprise a large proportion of the student body.
Transfers, particularly those who come from community colleges, have the opportunity to earn a college degree at a reduced cost by earning community college credits before seamlessly transferring to finish a bachelor’s degree at Texas Woman’s. The goal date of 2028 aligns with the university’s five-year strategic plan developed through 2022.
The table summarizes data from the current IPEDS Outcome Measure to reflect the graduation rate of the whole degree-seeking Texas Woman’s undergraduate population based on entering, degree-seeking cohorts:
Goal: By 2028, TWU’s graduation rate for the combined first time in college and transfer student populations will be 65%.
swipe to see the full table⇨
| Student | 2011-12 | 2012-13 | 2013-14 | 2014-15 | 2015-16 | 2016-17 | 2017-18 | |||||||
|---|---|---|---|---|---|---|---|---|---|---|---|---|---|---|
| Rate | Weight | Rate | Weight | Rate | Weight | Rate | Weight | Rate | Weight | Rate | Weight | Rate | Weight | |
| FTIC, full-time | 35% | 0.33 | 42% | 0.37 | 43% | 0.38 | 47% | 0.37 | 48% | 0.37 | 47% | 0.41 | 44% | 0.38 |
| FTIC, part-time | 12% | 0.01 | 30% | 0.01 | 16% | 0.01 | 23% | 0.01 | 17% | 0.01 | 28% | 0.01 | 30% | 0.01 |
| Transfer, full-time | 62% | 0.40 | 67% | 0.39 | 68% | 0.38 | 66% | 0.37 | 65% | 0.37 | 63% | 0.35 | 68% | 0.36 |
| Transfer, part-time | 53% | 0.26 | 52% | 0.23 | 56% | 0.23 | 56% | 0.24 | 53% | 0.24 | 55% | 0.23 | 56% | 0.25 |
| Overall cohort graduation rate | 50.6% | 53.8% | 55.6% | 56% | 54.8% | 54.3% | 55.5% | |||||||
Pioneer Perseverance
Texas Woman's strives to provide the resources, aid and inspiration to get you through the toughest first years.
At TWU, a student's likelihood of achieving graduation directly correlates with completing your freshman and sophomore years.
TWU has seen an upward trend in two-year persistence since 2013. To continue this trend, TWU aims to increase two-year persistence by 10 percent. This overall increase will put TWU ahead of the 59.5 percent average two-year persistence of its doctoral research peer group.
Two-Year Persistence Rates
swipe to see the full table⇨
Goal: By Fall 2024, increase undergraduate two-year persistence by 10% over the 2013 entering cohort.
| Year | Fall 2014 | Fall 2015 | Fall 2016 | Fall 2017 | Fall 2018 | Fall 2019 | Fall 2020 | Fall 2021 | Target |
|---|---|---|---|---|---|---|---|---|---|
| Persistence Rate | 62.0% | 63.2% | 62.6% | 58.6% | 61.5% | 61.0% | 56.5% | 59.1% | 70% |
Rate of Employed Graduates
Texas Woman’s is proud to say more than 84 percent of our graduates are working or enrolled in graduate or professional school within one year of graduation.
This rate, well above the average for other Texas universities, shows TWU’s dedication to going the extra mile for our students’ success, with:
- More than 100 career fairs, seminars and networking opportunities per year
- More than 140 student organizations
- Access to TWU Connect for students and alumni
swipe to see the full table⇨
Goal: For the fall 2022 cohort, 85% of graduates will be working or enrolled in a graduate or professional school within one year of graduation.
| Academic Year | Rate |
|---|---|
| 2014-2015 | 86% |
| 2015-2016 | 85.6% |
| 2016-2017 | 85.2% |
| 2017-2018 | 84.6% |
| 2018-2019* | 85.4% |
Source: Texas Higher Education Coordinating Board