Results
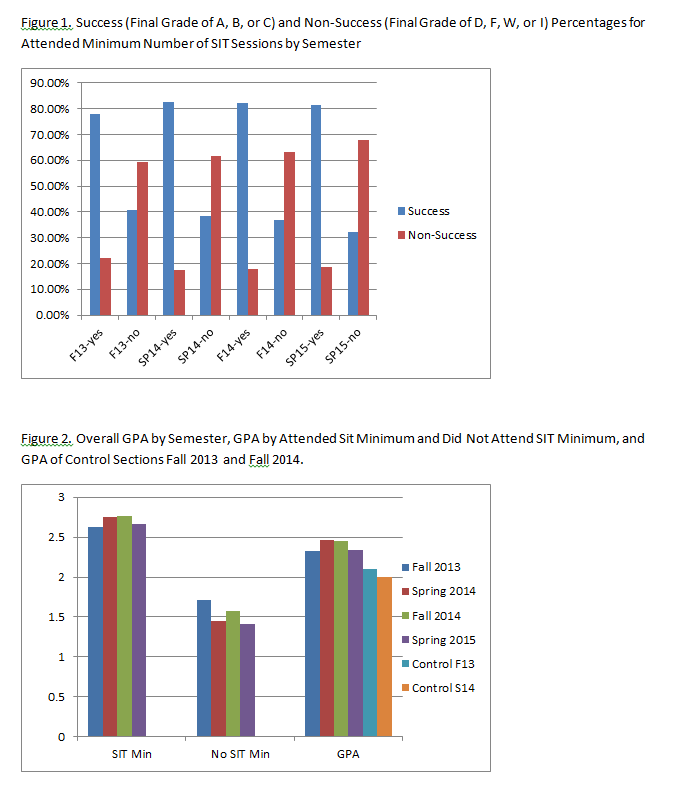
Each semester the students who attended the minimum number of four SIT sessions were more successful than those who did not attend the minimum number of SIT sessions. Success is defined as completing a course with a grade of an A, B, or C; lack of success is defined as ending the course with a grade of D, F, or W.
The figures by semester illustrate the aggregated results for the CSSP/SIT Program (click on the link provided below for each semester/year to access the figures). Figure 1 is the grade distribution for all SIT-supported classes, and Figure 2 is the GPA for SIT-supported sections compared to a Control group. In Fall 2013 and Spring 2014 a Control class was selected for comparison. However, in 2014-2015 all sections of some courses were supported by SIT, thus the control results from 2013-14 are also included for comparison to the 2014-15 aggregated data. In the aggregated data, as well as in the individual course sections, students who attend the minimum required number SIT sessions (4) outperform those who do not.
Page last updated 10:14 AM, December 6, 2016